Autonomous
Driving
Driving
SDLane
SDLane dataset은 자율주행을 위한 새로운 차선 dataset입니다. Dataset은 고속도로와 도심의 복잡한 시나리오를 담은 1920 X 1208 픽셀의 고해상도 이미지를 제공합니다. SD Lane dataset는 정확한 실측 라벨이 포함된 39K 훈련 이미지와 4K 테스트 이미지로 구성됩니다. 각 장면은 도로에 보이는 모든 2D 차선 형상은 수동으로 annotation을 달았습니다. 또한, 자차의 위치를 더 잘 유추하기 위해 가장 왼쪽 차선 표시를 기준으로 각 차선의 인덱스를 주석으로 표시했습니다.
Download the SDLane Dataset
Label Format
JSON 포맷의 annotation은 아래와 같습니다:
{
"geometry": [[(x1,y1),(x2,y2)],[(x3,y3),(x4,y4)]]     # array of x,y coordinates
"idx": [0, 1]                                                               # index relative to the leftmost lane
}
Folder Structure
Training set와 test set 모두에 대해 이미지 경로, JPEG 이미지 및 해당 annotation JSON 파일 목록이 포함된 TXT 파일을 제공합니다.
SDLane/
  └── train/
              ├── train_list.txt
              ├── images/
                        ├── 5bbb9c8402a48a0f7eab3af7692743953136faf4/
                                  ├── 0001.jpg/
                                  ├── 0002.jpg/
              ├── labels/
                        ├── 5bbb9c8402a48a0f7eab3af7692743953136faf4/
                                  ├── 0001.json/
                                  ├── 0002.json/
  └── test/
            ├── test_list.txt
            ├── images/
                      ├── 5bbb9c8402a48a0f7eab3af7692743953136faf4/
                                ├── 1313.jpg/
                                ├── 1315.jpg/
            ├── labels/
                      ├── 5bbb9c8402a48a0f7eab3af7692743953136faf4/
                                ├── 1313.json/
                                ├── 1315.json/
Citation
SD Lane 활용시 아래 citation을 이용해주세요.
@inproceedings{SDLane,
        author = {Dongkwon Jin, Wonhui Park, Seong-Gyun Jeong, Heeyeon Kwon, Chang-Su Kim},
        title = {Eigenlanes: Data-Driven Lane Descriptors for Structurally Diverse Lanes},
        booktitle = {Conference on Computer Vision and Pattern Recognition (CVPR)},
        year = {2022}
Tutorial
SDLane Dataset Tutorial
In this tutorial, you will learn how to generate a segmentation label for each corresponding image. We also provide a code block to overlay lane segmentation labels on the image.
To run this tutorial, please download the dataset from https://42dot.ai/akit/dataset/ and install the following packages, os, json,matplotlib, numpy,PIL and opencv_python.
To run this tutorial, please download the dataset from https://42dot.ai/akit/dataset/ and install the following packages, os, json,matplotlib, numpy,PIL and opencv_python.
In [1]:
import os
import json
import matplotlib.pyplot as plt
import numpy as np
from PIL import Image
import cv2
In [2]:
# Dataset directory
ROOT = # please update
DATALIST_PATH = os.path.join(ROOT, 'test_list.txt')
Load Image and Annotation
In [3]:
# Load datalist
with open(DATALIST_PATH) as f:
      datalist = [line.rstrip('\n') for line in f]
In [4]:
def get_label(datalist, idx):
    """
    returns the corresponding label path for each image path
    """
    image_path = datalist[idx]
    label_path = image_path.replace('images', 'labels').replace('.jpg', '.json')
    return image_path, label_path


def load_json(label_path):
    with open(label_path, "r") as f:
            annotation = json.load(f)
    return annotation


image_path, label_path = get_label(datalist, idx=0)


# absolute path
image_path = os.path.join(ROOT, image_path)
label_path = os.path.join(ROOT, label_path)
In [5]:
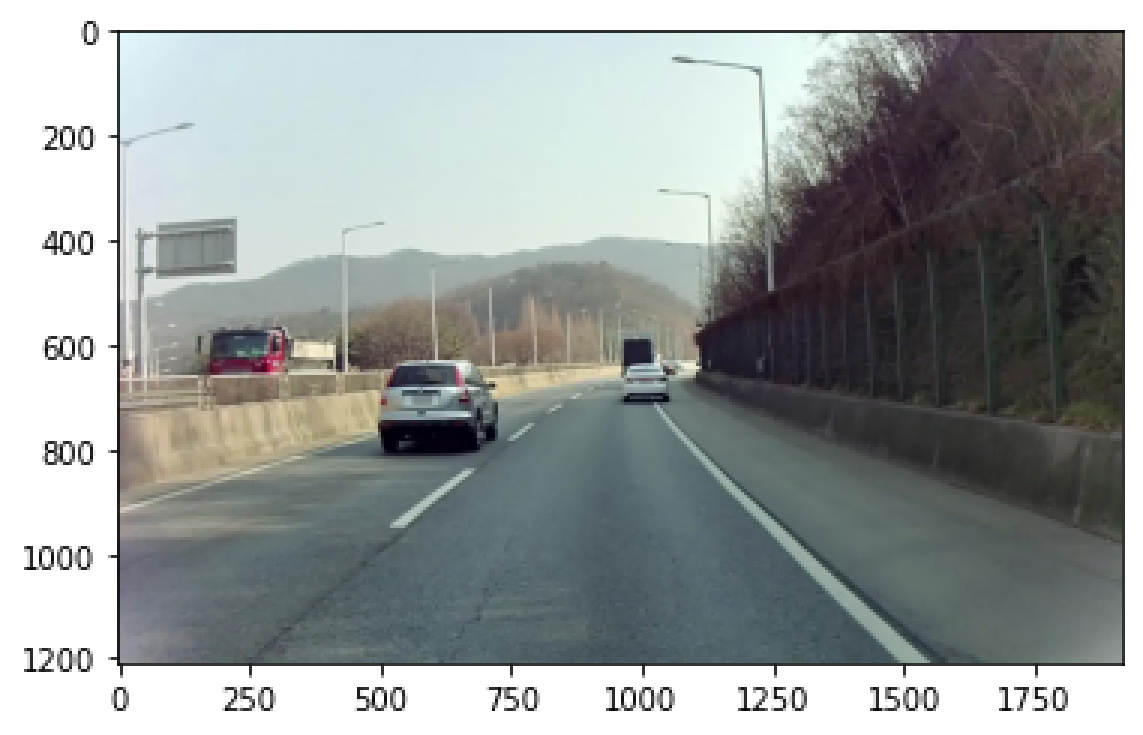
# visualize image
img = plt.imread(image_path)
plt.imshow(img)
<matplotlib.image.AxesImage at 0x7fd86951f050>
In [6]:
# load raw annotation data
annotation = load_json(label_path) # key = ['geometry', 'idx']
Visualize Segmentation Labels
In [7]:
def generate_seg_label(annotation, vis=None, height=1208, width=1920):
"""
generates segmentation Labels
"""
if vis is None:
vis = np.zeros((height, width, 3), dtype=np.uint8)
vis = np.ascontiguousarray(vis)
lane_geometry = annotation['geometry']
pts = [np.int32(lane) for lane in lane_geometry if not len(lane)==0]
vis = cv2.polylines(vis, pts, False, (0, 255, 0), 10)
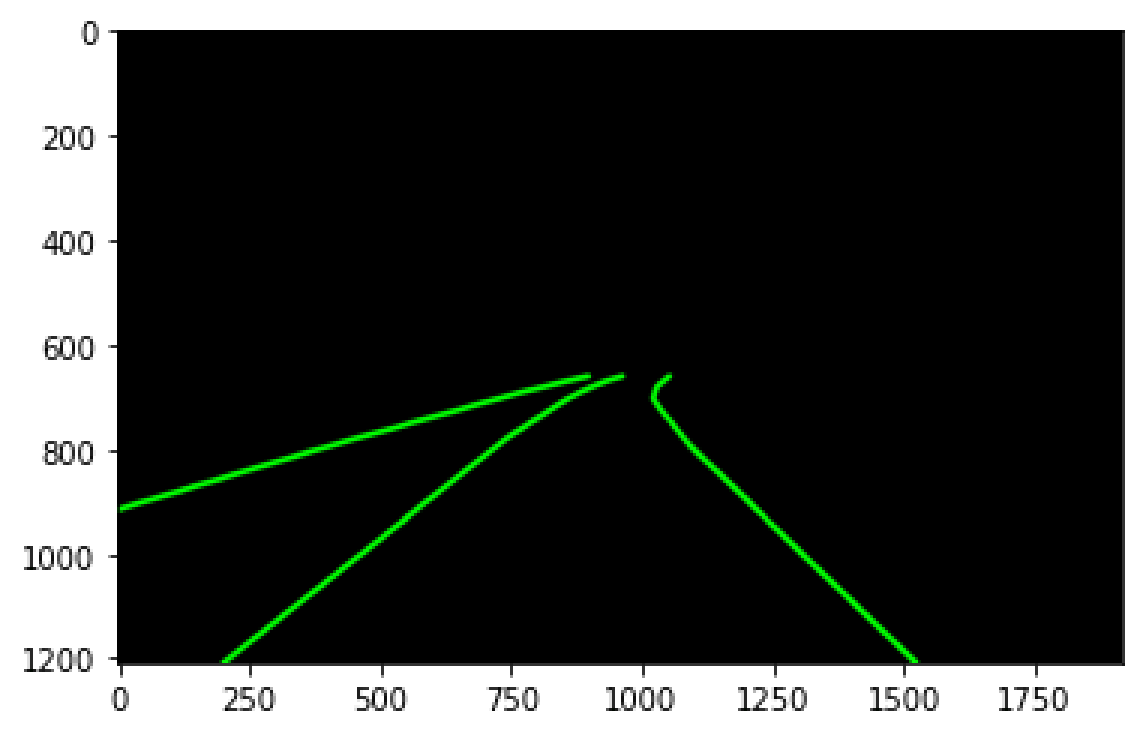
return vis In [8]:
# visualize segmentation label
vis = generate_seg_label(annotation)
plt.imshow(vis)
<matplotlib.image.AxesImage at 0x7fd8691fac10>
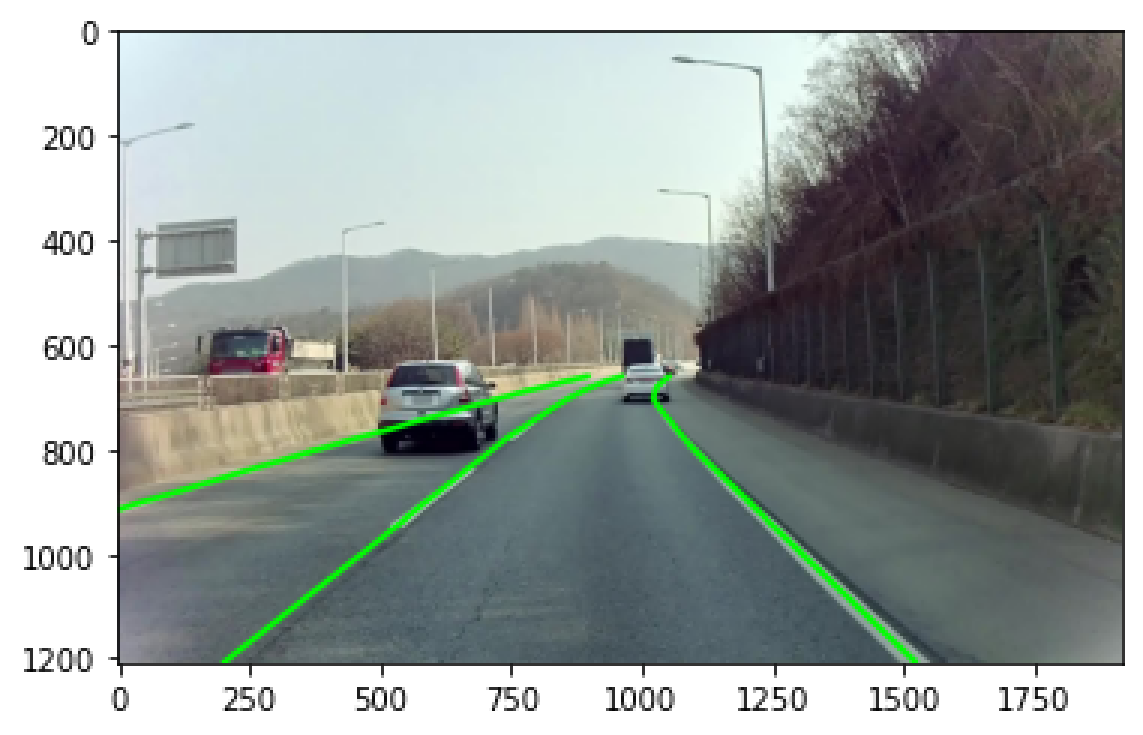
In [9]:
# overlay segmentation label on the original image
vis = generate_seg_label(annotation, img)
plt.imshow(vis)
<matplotlib.image.AxesImage at 0x7fd8691f29d0>
Download the SDLane Dataset